Part 1. Global-Scale Forest Height Estimation Introduction of the problem of estimating tree height from satellite data, its challenges and how we have overcome them in our ICML24 paper.
Global-Scale Forest Height Estimation
Our paper Estimating Canopy Height at Scale was accepted to ICML 2024! In this work, we present a novel framework for global-scale forest height estimation. Using a deep learning approach that leverages large amounts of satellite data with only sparsely distributed ground-truth height measurements from NASA's GEDI mission, we achieve state-of-the-art accuracy with MAE/RMSE of 2.43m/4.73m overall, significantly outperforming existing approaches. The resulting height map facilitates ecological analyses at a global scale.
Part 1 of 2
Series: Tree Canopy Height Estimation
This post is part of a series of posts on tree canopy height estimation using deep learning and satellite data.
Intro: Why Forest Monitoring Matters
Knowing the health and structure of forests is essential for combating climate change. Forests act as a natural carbon sink, absorbing around half of the $CO_2$ from human activities, while also providing habitat for countless species. Yet traditional forest monitoring relies on field workers manually measuring individual trees, an approach that is highly accurate but impractical at global scale. How can we monitor ecosystems that cover nearly one-third of the Earth’s land?
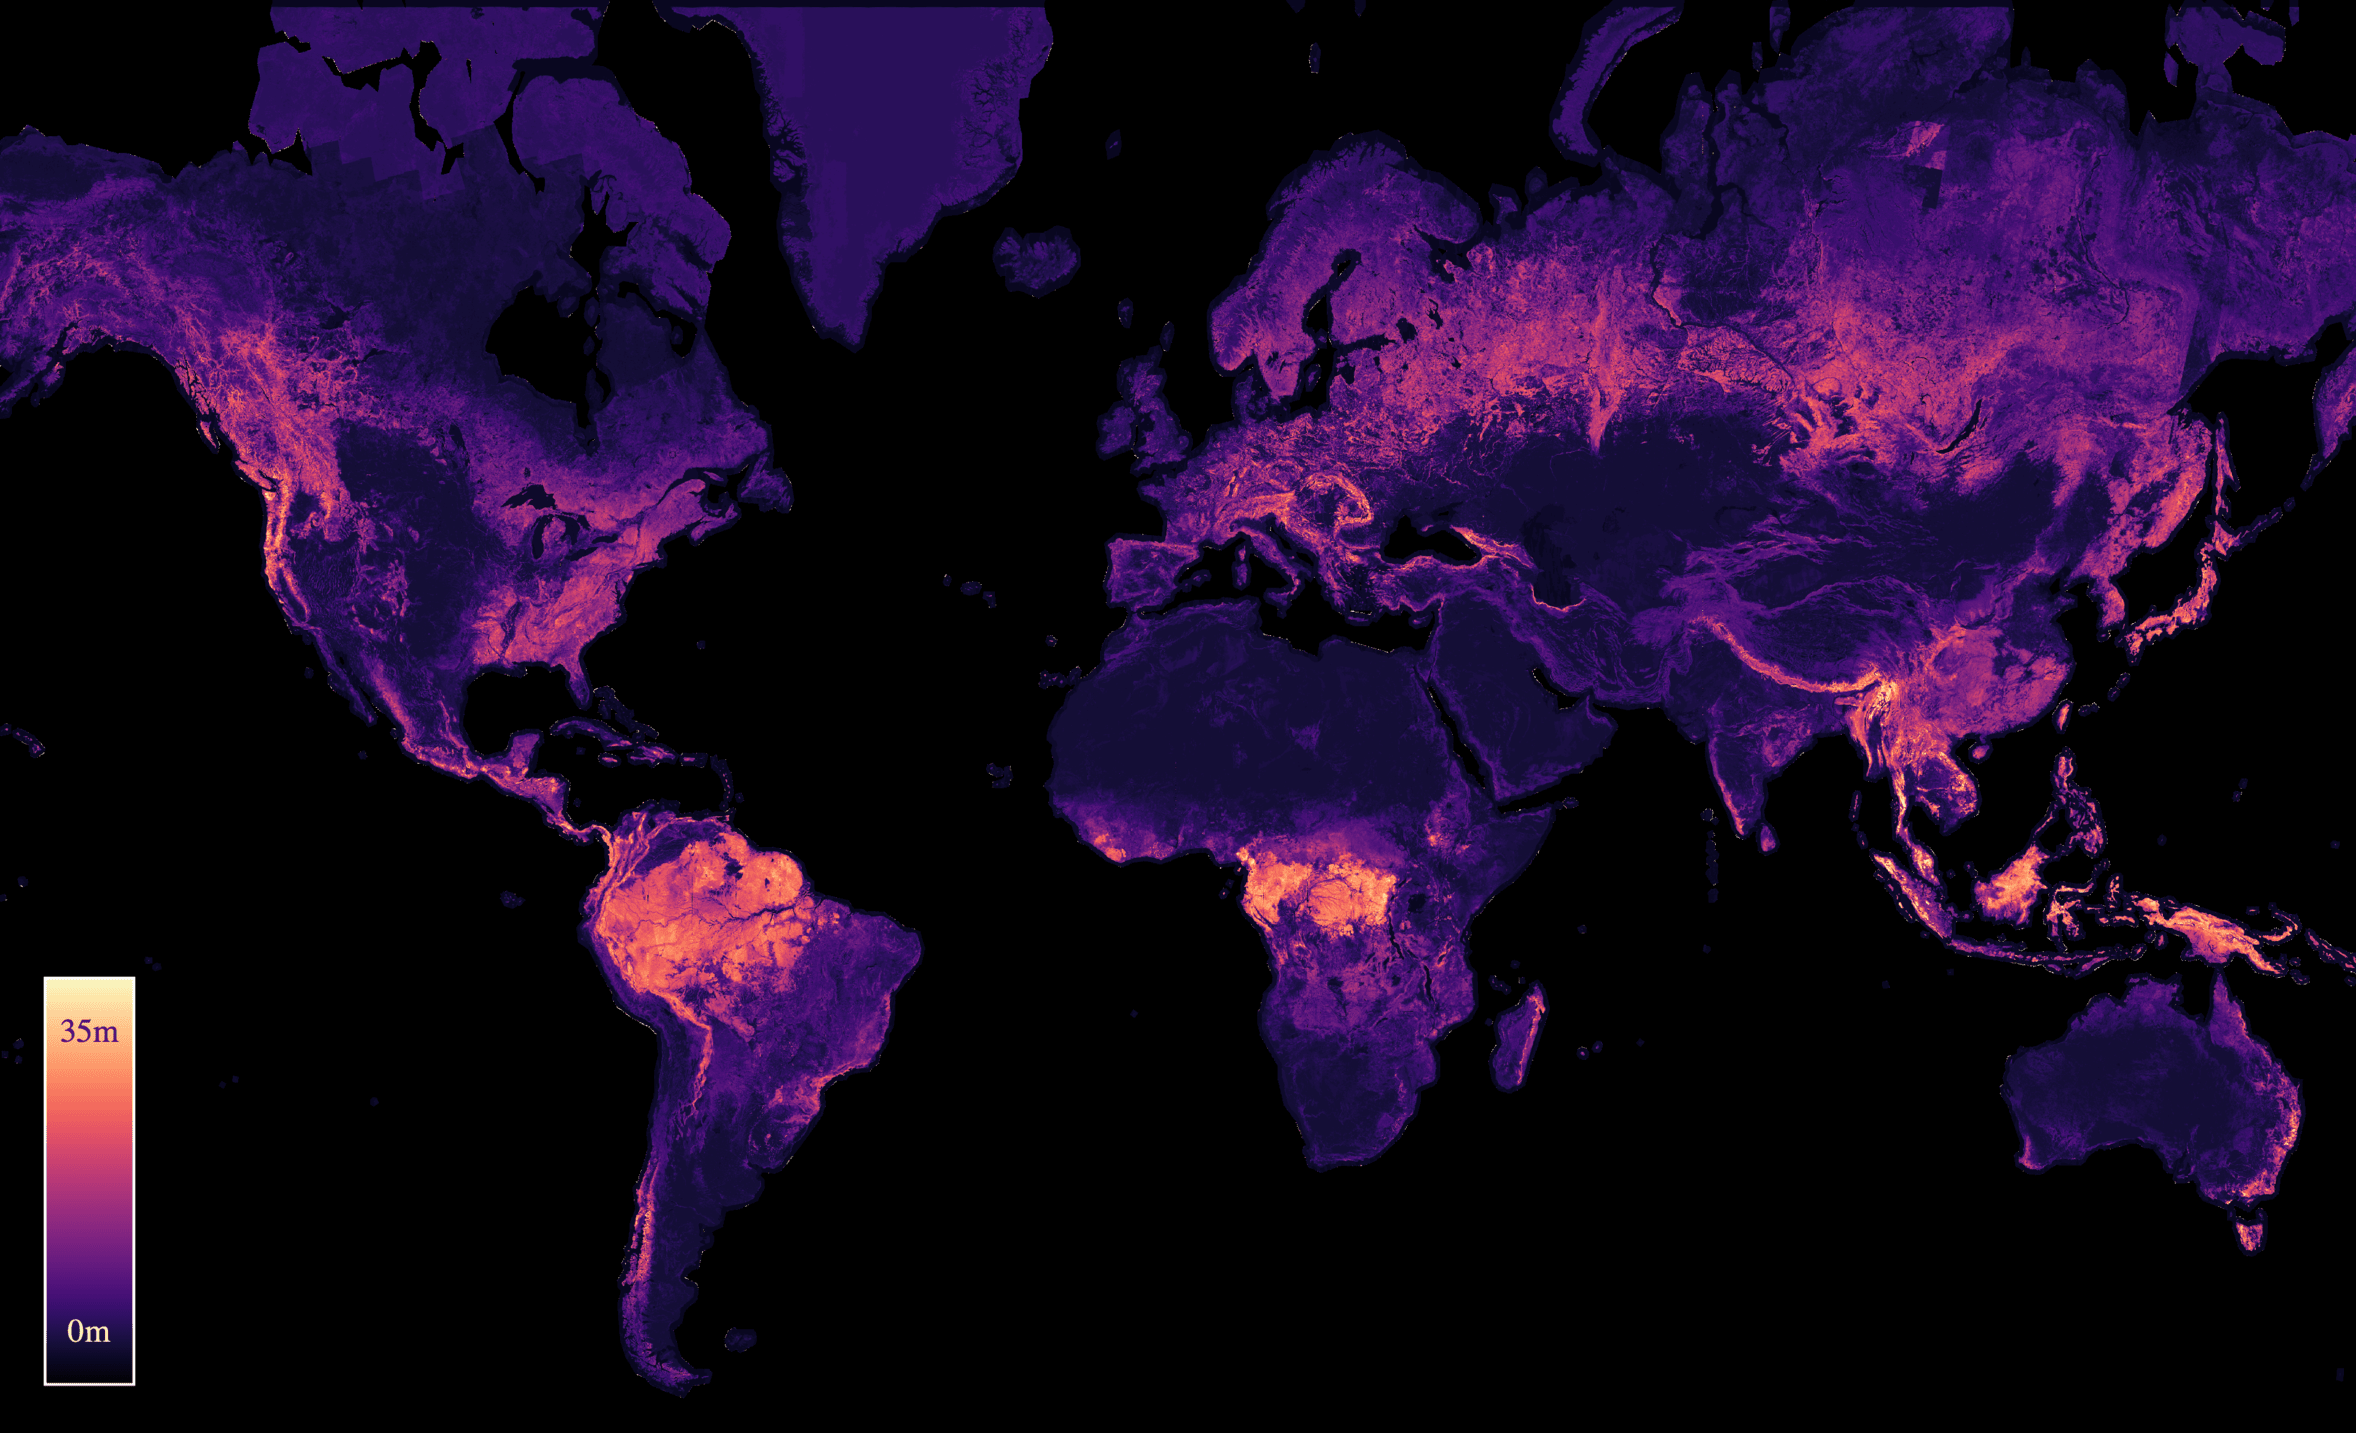
Our new global canopy height map shows forest heights across the world, with colors indicating tree heights from 0m (black/purple) to 35m+ (yellow).
Accurate forest height maps allow scientists to understand how much carbon forests store and how it is distributed, to identify and protect old-growth forests, and to make informed decisions about conservation. The method presented here provides more precise height estimates than previous maps, especially for short vegetation and complex forest areas, enhancing the ability of scientists and policymakers to understand and protect forest resources.
The Challenge of Global Forest Monitoring
Traditional forest monitoring through manual measurement of individual trees provides highly accurate data, but it clearly becomes impractical when trying to assess forests at a large scale. Furthermore, there’s a stark divide in monitoring capabilities: industrialized nations often have sufficient resources to conduct comprehensive forest surveys, while many others lack the necessary resources to perform extensive monitoring of their forest landscapes.
Satellite technology offers a way forward. Modern satellites can regularly observe the entire Earth, offering a consistent way to monitor forests and general vegetation ecosystems worldwide. In particular, the GEDI mission, which is a full-waveform laser system on the International Space Station, can measure the height of every tree on the surface of the Earth. In practice however, the GEDI measurements are sparsely-distributed, taking up only a tiny fraction of the Earth’s total surface area. This is visible in the image below, where the GEDI measurements are shown in red/yellow dots.
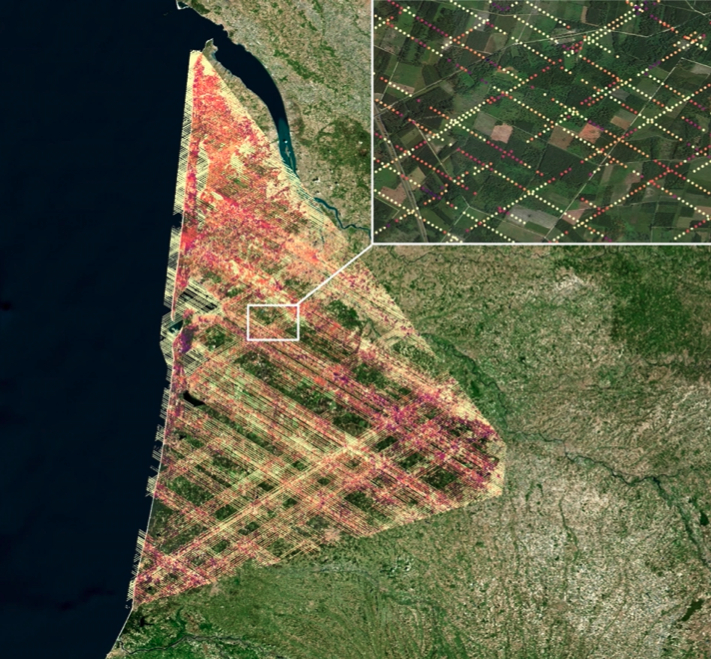
Satellite image overlaid with actual tree height measurements (red/yellow dots) from NASA's GEDI laser system. As the GEDI system is onboard the ISS, you can clearly see the ISS flight paths in the image.
The sparse distribution of GEDI measurements poses a fundamental challenge for creating a global map of forest heights. This is where deep learning comes into play. We introduce a methodology to create a detailed, global-scale map of forest heights using supervised deep learning on satellite data, combining:
- Radar images that can see through clouds (Sentinel-1) as input
- Optical images that show forest detail (Sentinel-2) as input
- Height measurements from NASA’s GEDI laser system as ground truth labels
In other words, we train a model that takes satellite images as input and predicts the height of each pixel, training on the sparse GEDI measurements as ground truth labels. But learning heights from satellite images is not easy. Problems like clouds, mountains, and measurement angles make it challenging to get a good estimate of the height of the trees. We discuss our main challenges below:
Challenge 1: Dealing with Clouds
Satellites follow fixed orbits and capture images on a regular schedule, regardless of cloud cover. While most regions experience clear skies at some point during the year, allowing us to select cloud-free images, tropical regions pose a unique challenge. The persistent cloud cover and high-altitude cirrus clouds in these areas make it difficult to obtain clear optical satellite imagery, necessitating innovative approaches to extract useful data.
Challenge 2: Mountains and Measurements
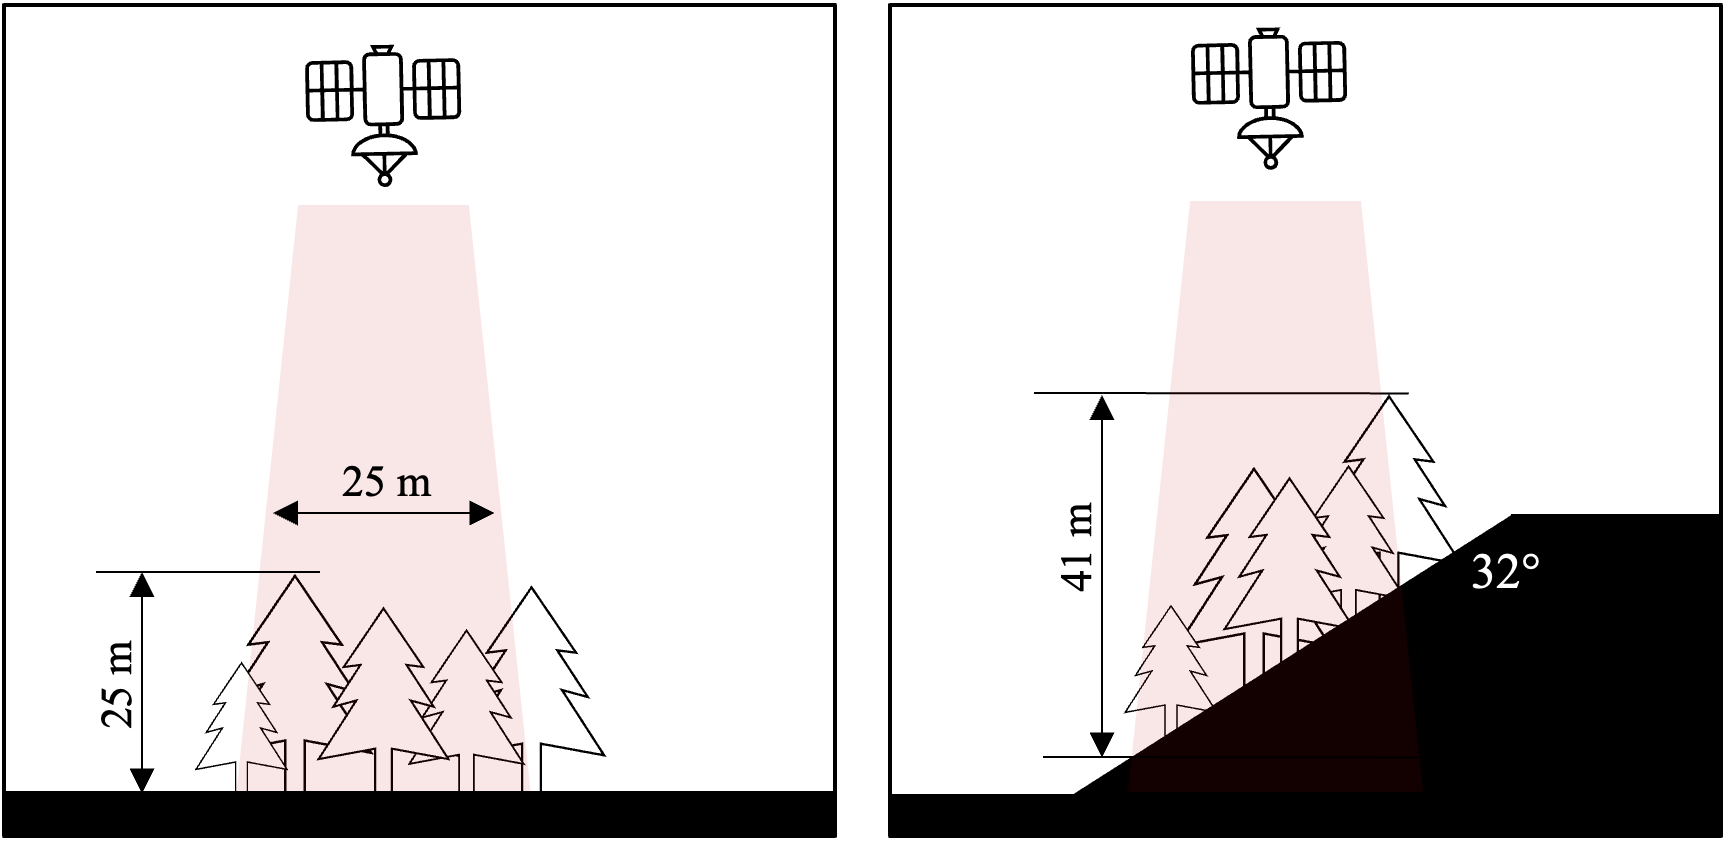
How slopes affect height measurements: the same tree might appear taller when measured on a slope, and even in the absence of trees, GEDI records a height measurement due to the elevation change within its footprint.
Mountainous terrain poses unique measurement challenges. GEDI’s laser technology measures the height difference between the highest and lowest points within a 25-meter diameter circle. On steep slopes, this can distort measurements in two ways: trees may appear artificially taller than their true height, and even bare slopes register as having “height” due to the elevation change within the measurement circle.
Challenge 3: Location Accuracy
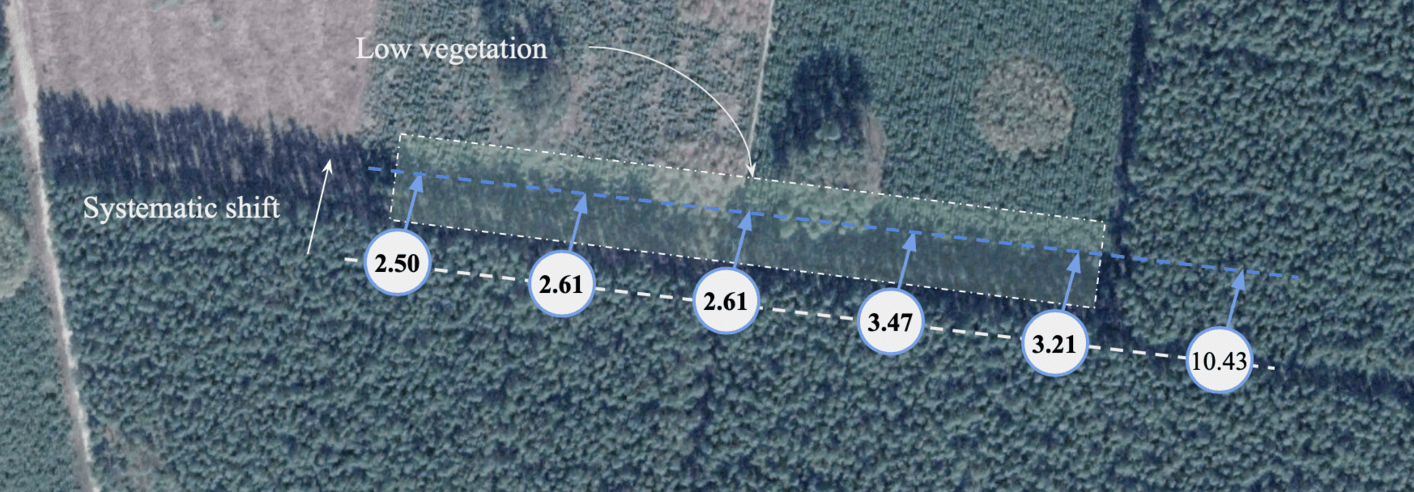
GEDI measurements can be slightly offset from their true location due to GPS and positioning errors (each circle shows a height measurement).
Even with accurate height measurements, GPS and satellite positioning errors can cause misalignment between reported and actual measurement locations. This spatial offset presents a critical challenge: how can we train a reliable model when the ground-truth data may be shifted from its true position?
Our Approach to Forest Height Estimation
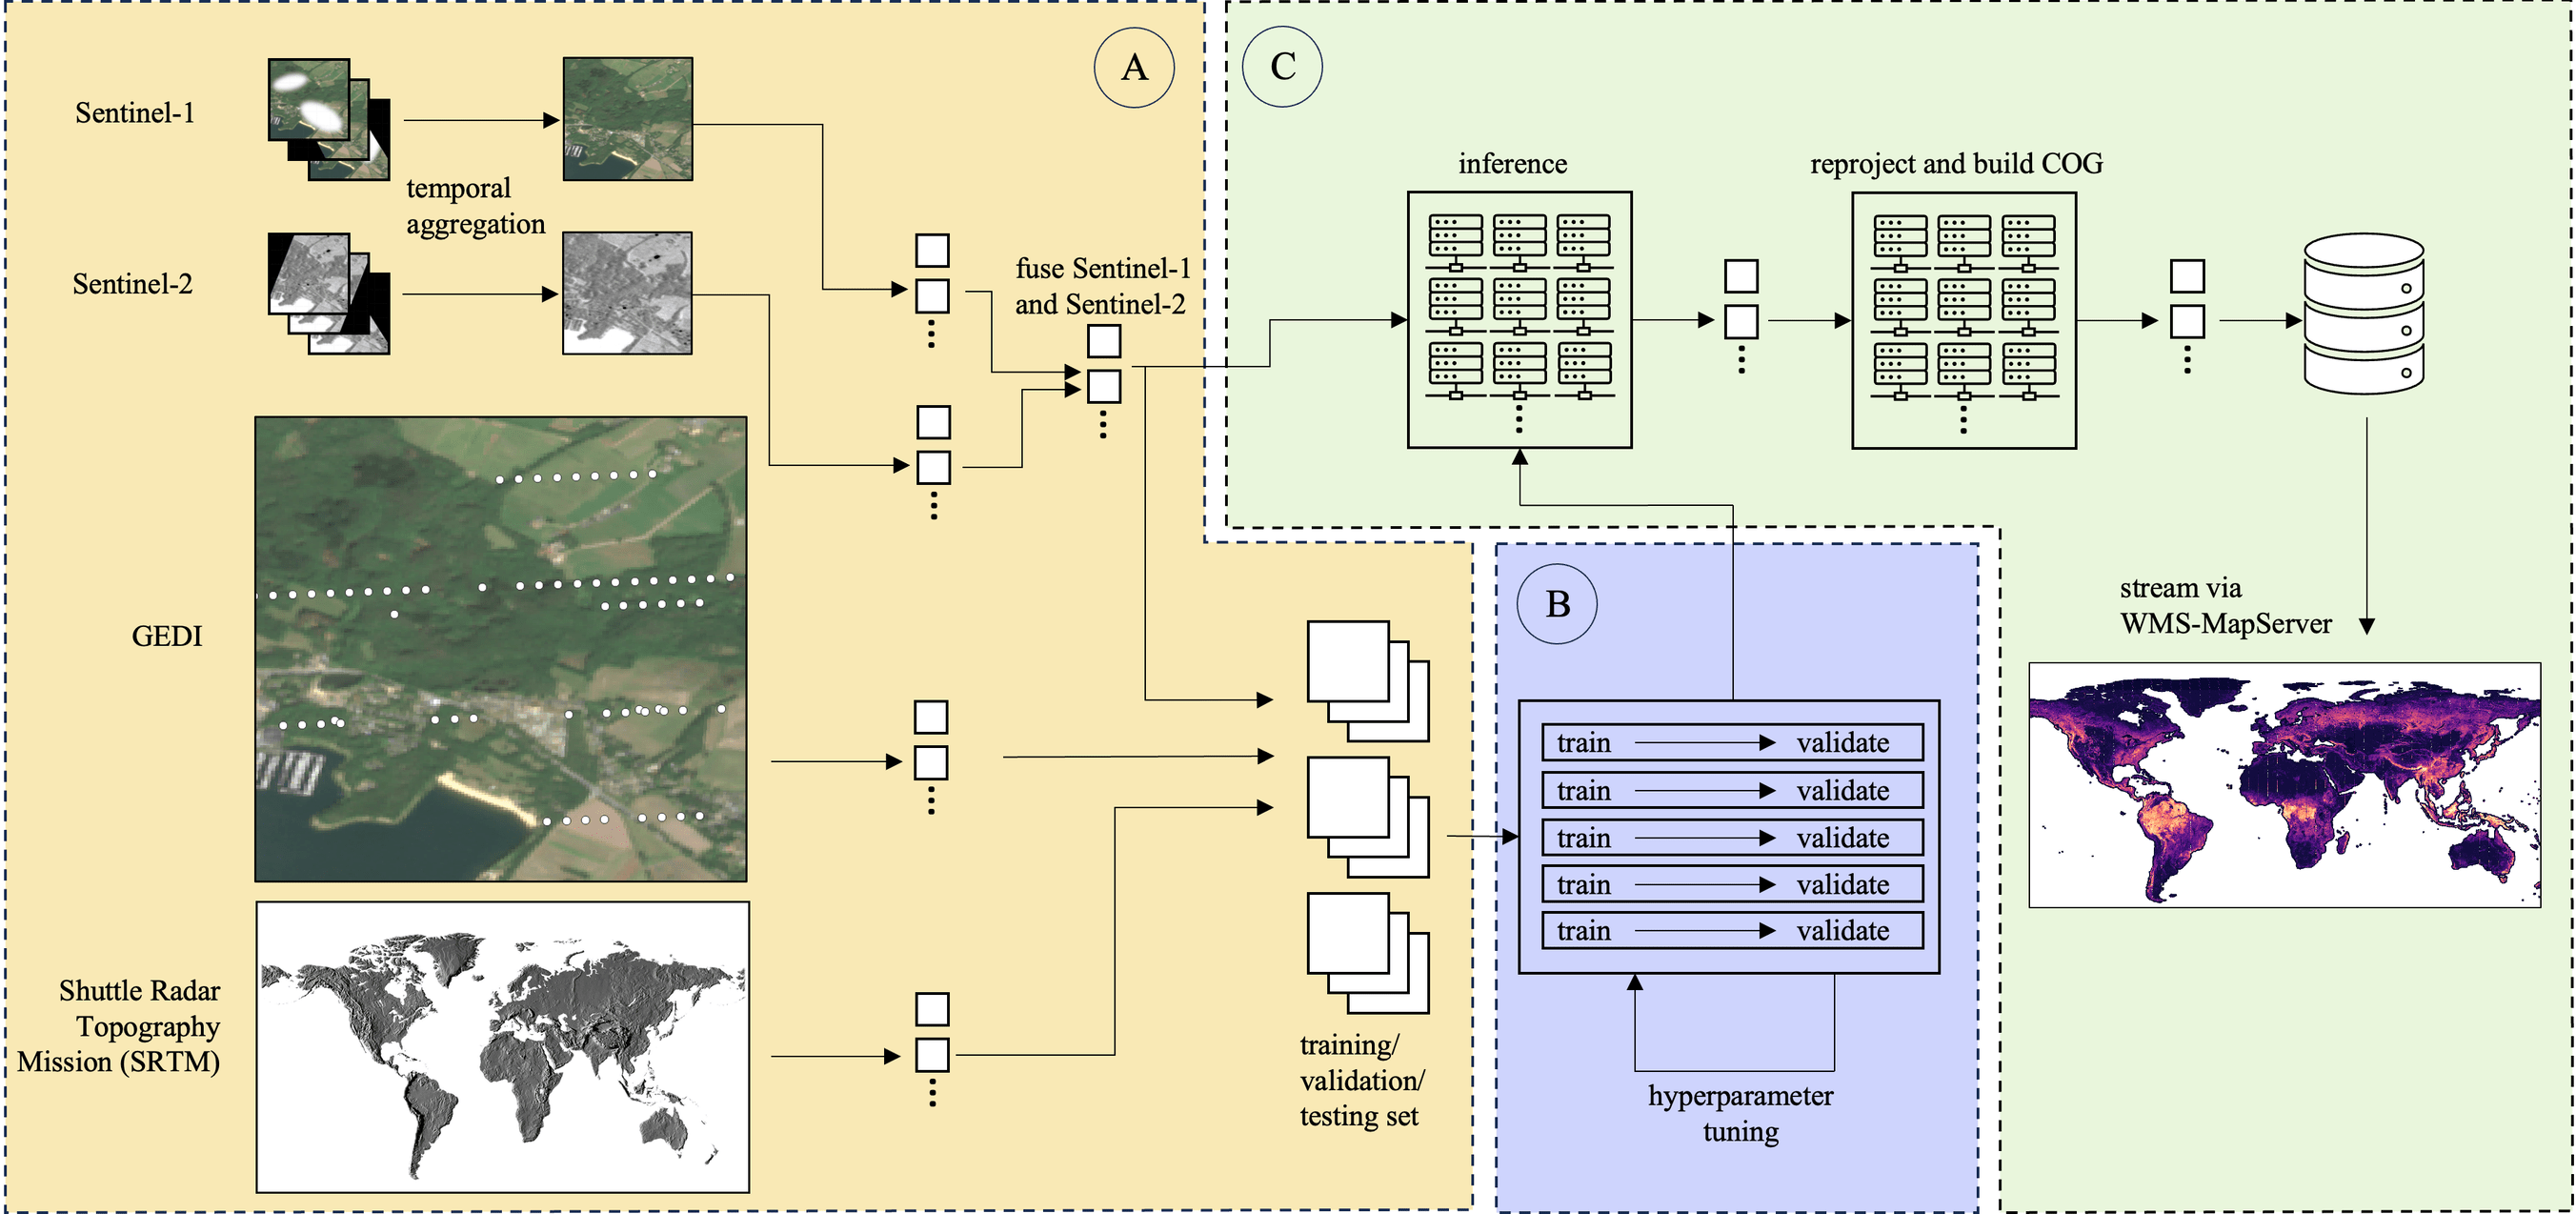
Overview of our approach: from satellite data to the global height map.
The solution involves three main components:
(1) Multiple Types of Satellite Data
Our approach leverages two complementary satellite data sources from ESA: Sentinel-2’s high-resolution optical imagery (similar to Google Maps) and Sentinel-1’s radar data. The radar signals can penetrate clouds and even some vegetation layers, providing crucial data in areas where optical sensors are limited. We combine these inputs with height measurements from NASA’s GEDI laser system on the International Space Station, which serve as our ground truth labels.
(2) Smart Cloud Handling
Although we use radar data, it is still beneficial to use optical data as often as possible, as it has a higher level of detail. We therefore try to construct a cloud-free image where possible. Sentinel-2 does not only capture a single image per year, but an image of the entire globe every 6 days. We therefore make use of all images and mask out clouds from every image. Lastly, we combine all images into a single image by taking the per-pixel median of all non-cloud pixel values. This step effectively removes almost all clouds from the image and reduced noise and inter-year-variability.
(3) Model Training
We used a special loss function to address location erros in our ground-truth measurements. Our loss function allows the model to shift the measurements within a certain range if it is similar for all nearby measurements. Secondly, we pre-filter our labels to remove measurements that were taken on areas with a great slope.
Results: Comparing to existing maps
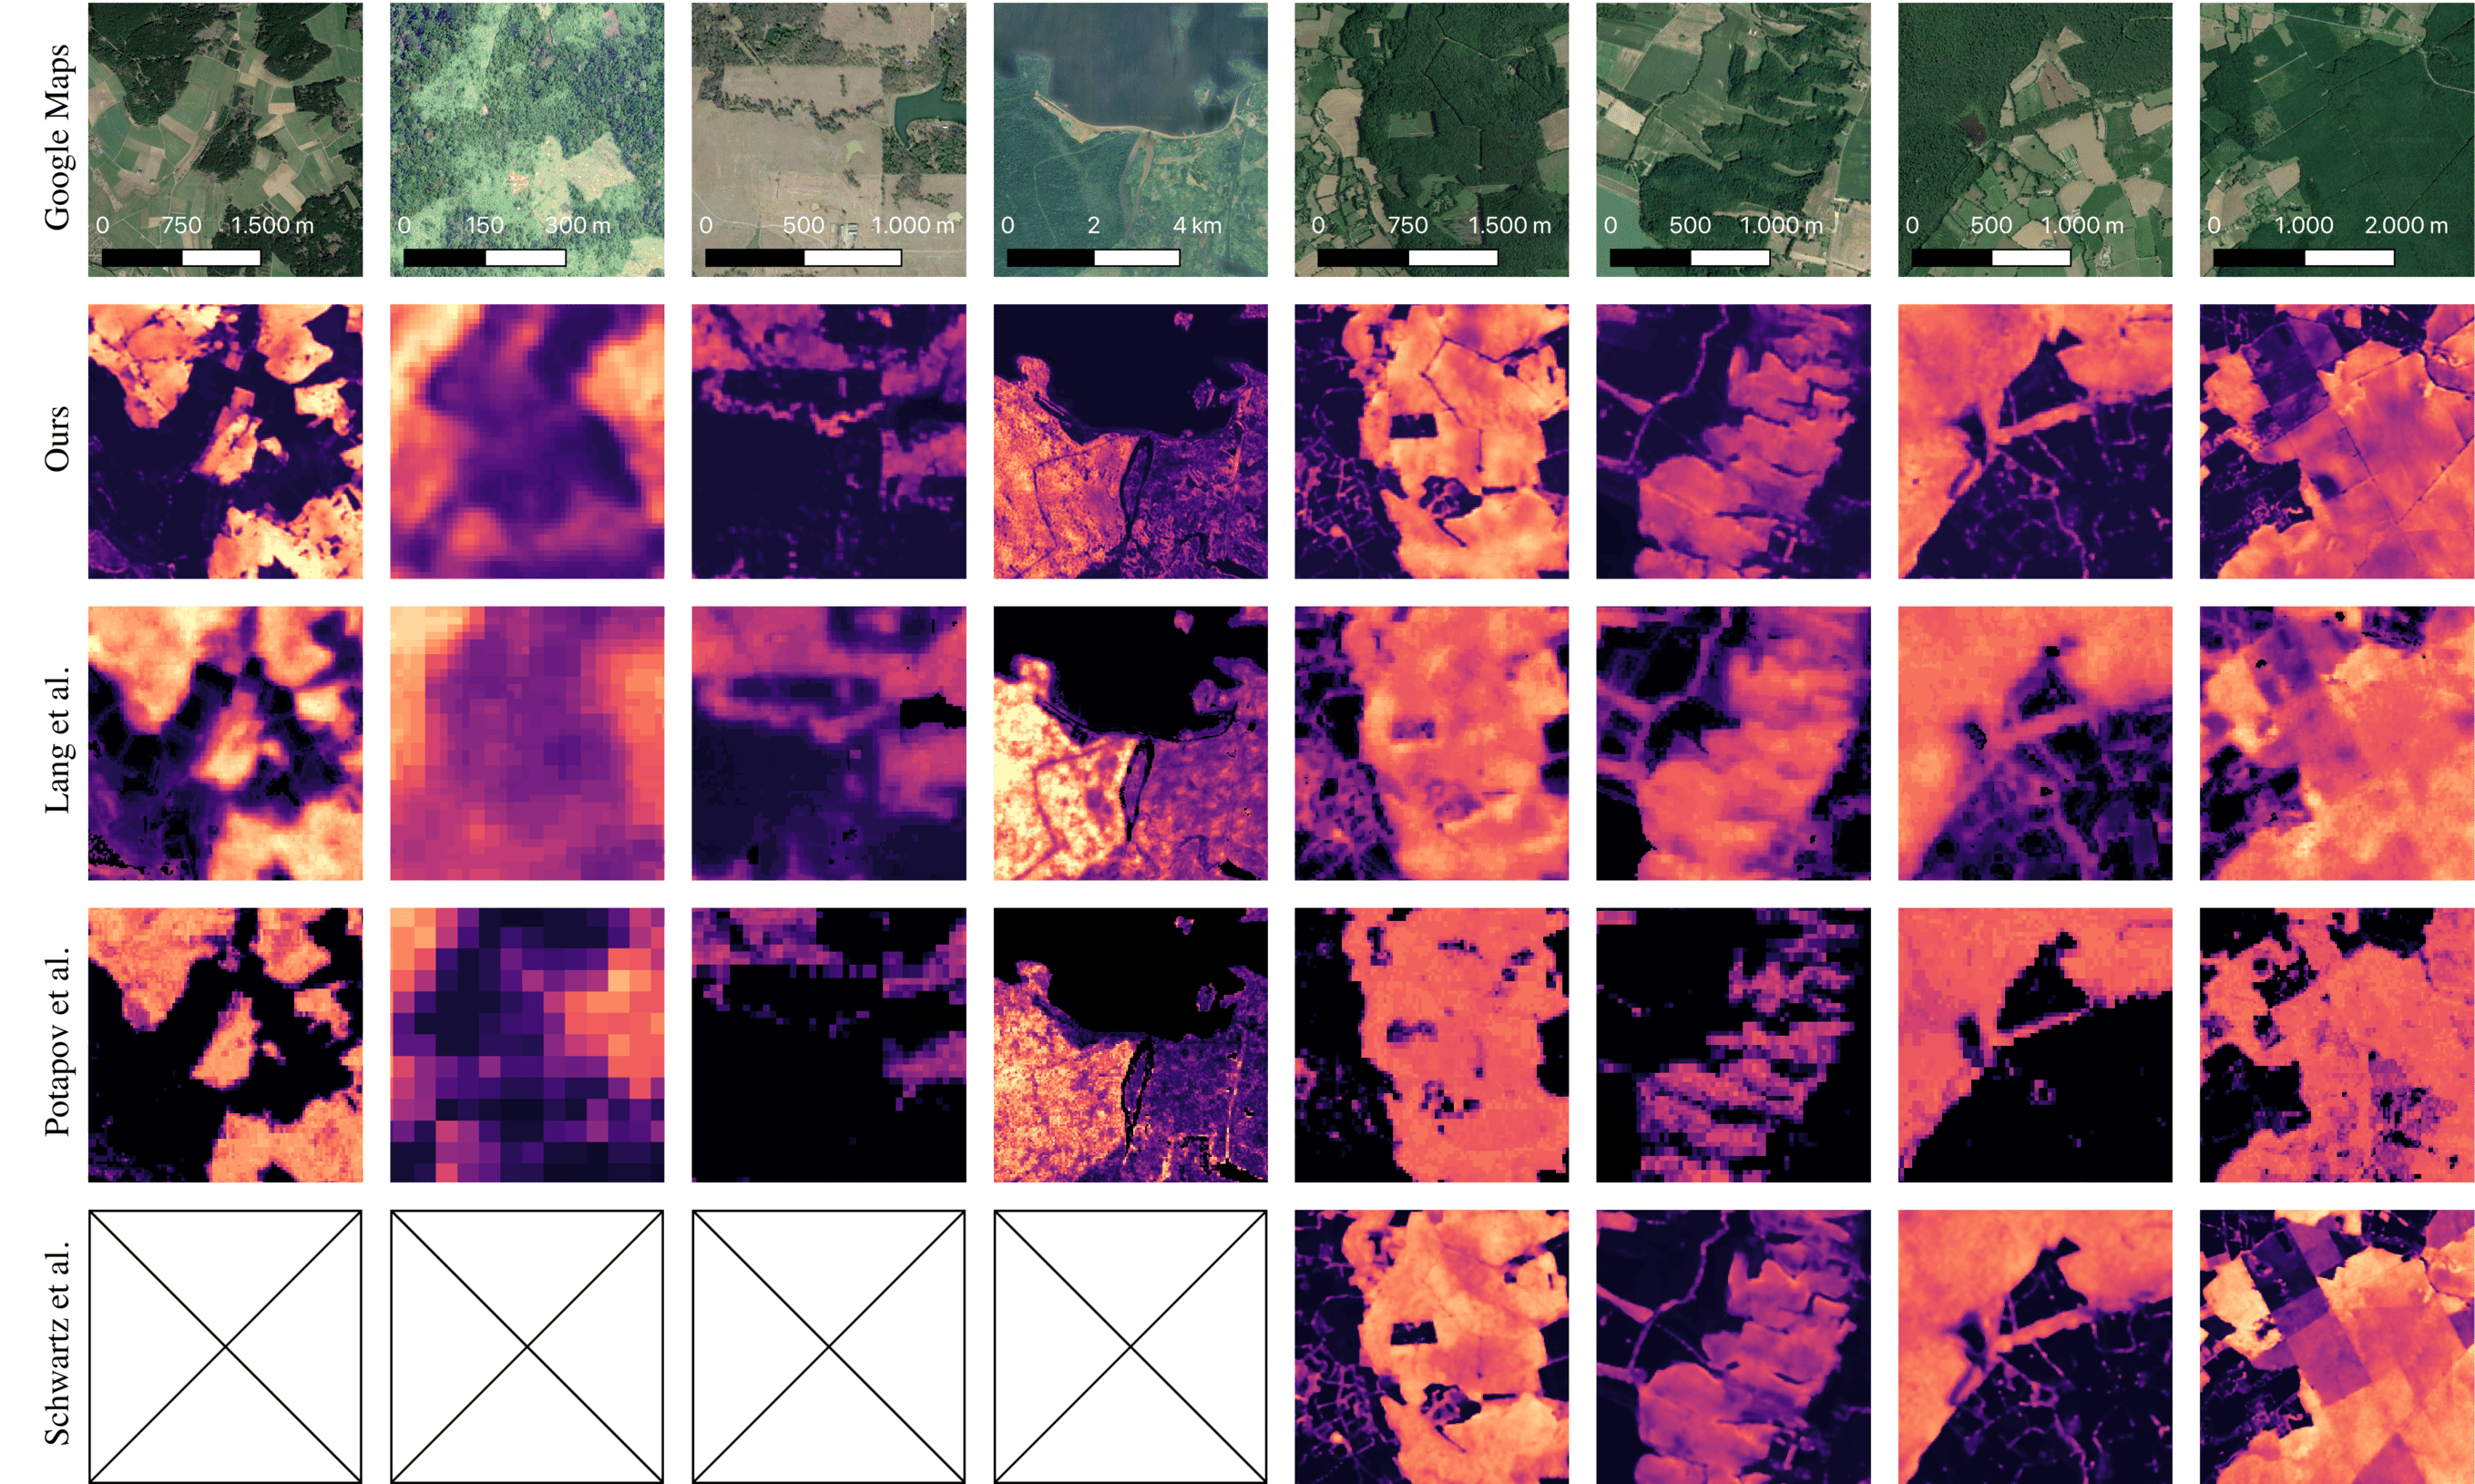
Comparison of our map (second row) with previous global maps and a detailed regional map (our benchmark). Notice the improved detail in our results.
Visually, our new method shows significant improvements over existing global maps, successfully surpassing their accuracy and detail levels. Specifically, we achieve better detail in forest structure, more accurate height estimates, and clearer distinction between forest and non-forest areas. The visual quality of our results even closely approaches that of specialized regional maps.
Let’s look at how well our method performs quantitatively. We compared our results with the two other existing global canopy height maps, namely the one from Lang et al.
| Method | Mean Absolute Error | Root Mean Square Error | Mean Absolute Error (for labels > 5m) | Root Mean Square Error (for labels > 5m) |
|---|---|---|---|---|
| Lang et al. | 6.47m | 8.62m | 8.80m | 11.02m |
| Potapov et al. | 6.92m | 9.25m | 10.01m | 12.43m |
| Our Method | 2.43m | 4.73m | 4.45m | 6.72m |
Performance comparison of different canopy height estimation methods.
Our method achieves significantly lower errors across all metrics. For trees taller than 5m, we maintain this advantage with a mean absolute error of just 4.45m. To better understand where our method performs well and where there’s still room for improvement, let’s look at the error distribution across different tree heights:
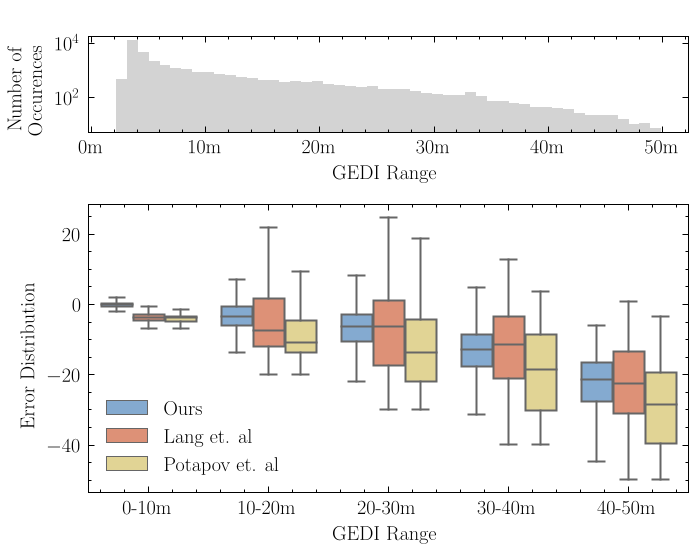
Error analysis across different height ranges. The boxes show the distribution of errors for each height range, with negative errors indicating underestimation. Notice how we (blue) maintain lower error rates and less variance, especially for trees up to 30m.
Looking at this analysis in detail, our method shows excellent performance for trees up to 20m in height, with strong accuracy continuing through the medium height ranges. However, we must acknowledge that very tall trees, particularly those above 30m, remain a significant challenge. This is especially pronounced in tropical forests, where canopy heights can exceed 40m - an important area we need to address in future work. Nevertheless, even with these challenges in tall tree estimation, our approach demonstrates notably lower error variance compared to previous methods across most height ranges.
Conclusion
Creating accurate global forest height maps is crucial for understanding and protecting our planet’s forests. Our method combines the latest satellite technology with machine learning to produce the most detailed and accurate global forest height map to date. While we’ve made significant progress, there’s still more to explore. Future improvements could include:
- Even better handling of mountainous regions
- More frequent updates to track changes over time
- Reducing the error for very tall trees
Want to explore forest heights in your area? Our global canopy height map is available on Google Earth Engine. You can view our predicted forest height information for any location on Earth here: worldwidemap.projects.earthengine.app/view/canopy-height-2020.
If you find this work useful, please consider citing our paper:
BibTeX
@inproceedings{pauls2024estimating,
  title={Estimating Canopy Height at Scale},
  author={Jan Pauls and Max Zimmer and Una M. Kelly and Martin Schwartz and Sassan Saatchi and Philippe Ciais and Sebastian Pokutta and Martin Brandt and Fabian Gieseke},
  booktitle={Forty-first International Conference on Machine Learning},
  year={2024},
  url={https://openreview.net/forum?id=ZzCY0fRver}
}