Capturing Temporal Dynamics in Tree Canopy Height
Our paper Capturing Temporal Dynamics in Large-Scale Canopy Tree Height Estimation was accepted to ICML 2025! In this work, we present a novel approach to generate large-scale, high-resolution canopy height maps over time. Using Sentinel-2 time series satellite data and GEDI LiDAR data as ground truth, we present the first 10m resolution temporal canopy height map of the European continent for the period 2019-2022. Our pipeline and the resulting temporal height map are publicly available, enabling comprehensive large-scale monitoring of forests.
Part 2 of 2
Series: Tree Canopy Height Estimation
This post is part of a series of posts on tree canopy height estimation using deep learning and satellite data.
Part 1. Global-Scale Forest Height Estimation Introduction of the problem of estimating tree height from satellite data, its challenges and how we have overcome them in our ICML24 paper.
Part 2. Capturing Temporal Dynamics in Canopy Height Part 2 reveals how we moved beyond a single-year map to track changes in canopy height over time, as detailed in our ICML25 paper.
Recap: Learning Forest Height at Scale
This is the second part of the series on Tree Canopy Height Estimation. In Part 1, we discussed the motivation for using deep learning techniques on satellite data for forest height estimation and the challenges involved. We have seen how our method overcomes key technical challenges to generate accurate, high-resolution canopy height maps, resulting in a global forest height map for the year 2020. This post extends that work in an important new direction: we now track the canopy height over time.
What Are We Missing?
While having a global forest height map might suggest that no more work is to be done, we are in fact missing out on a lot of information. In this post, we will explore some of the limitations of our current approach and discuss directions for improvements (and, unsurprisingly, how we successfully address them). Two significant issues become apparent:
1. Tall trees are underpredicted.
Current models often struggle to accurately predict the height of tall trees. There’s a consistent underestimation that worsens as the trees get taller. This is a big issue because large trees store most of the carbon, making their accurate prediction crucial for climate analysis.
2. Maps only capture a single year.
Most maps, including our previous work, only capture a single moment in time. However, forests change due to disturbances, logging, and regrowth. Without tracking these changes, we miss the complete picture and can’t fully understand forest history or make informed predictions for the future.
Before we discuss how we tackle these challenges, check out the figure below from our paper. It’s a short teaser of how much better we have gotten at predicting tall trees, comparing our latest work with the previous best and ALS data, which we aim to match.
Comparison of six canopy height maps with precise measurements obtained via aerial laser scanning (ALS). The patches contain tall trees exceeding 30 m in height. Our model is the only one that can accurately estimate the height of such trees.
Addressing the Challenges
With these two problems in mind, we aimed to enhance the model from our previous work
Regarding the challenge of estimating tall trees, we identified a flaw in almost all existing models: they are trained on composite images, which are aggregations of all images captured over a year. In our previous work, we used the median of images taken at different times. This approach results in a loss of valuable information. We observed that Sentinel-2 images are not perfectly geolocated, and using images from different times allows the model to exploit these minor geolocation errors. Since the satellite does not fly over the exact same spot each time, each 10m pixel captures a slightly shifted reflection of the ground.
As a solution, we change our model architecture to a 3D U-Net
We further train not only on image and label for a single year, but from all images and labels from 2019 to 2022 (all years with full GEDI coverage). This way our model becomes invariant to different year-specific color variations and we can apply it to multiple years to get a temporal change map.
Our results
Since we do not preprocess our data to create composite images, the datasets we use are twelve times larger than in our previous work. In consequence, we limit our training and analysis to the European continent, comparing the following maps restricted to this region: Tolan et al. (2023)
| Map | Source | MAE [m] | MSE [m²] | RMSE [m] |
|---|---|---|---|---|
| Tolan et al. (2023) | Maxar | 11.25 | 212.14 | 13.25 |
| Liu et al. (2023) | Planet | 8.17 | 138.25 | 10.36 |
| Lang et al. (2022) | S2 | 5.74 | 84.68 | 7.57 |
| Pauls et al. | S1/2 | 5.46 | 83.14 | 7.40 |
| Turubanova et al. | Landsat | 12.39 | 252.57 | 14.14 |
| Ours | S1/2 | 4.76 | 74.28 | 6.75 |
Despite the coarser 10 m resolution of Sentinel-1/2 (S1/2) compared to Planet (3 m) and Maxar (60 cm), our model yields highly accurate maps and achieves the best overall performance.
Our novel approach contributes in three key areas:
Contribution 1: We obtain a new state-of-the-art 2020 Height Map for Europe.
Our model outperforms all previous models in both quantitative and qualitative assessments. Compared to the second-best model, we achieve improvements of 13% in MAE, 11% in MSE, and 9% in RMSE. Additionally, our approach provides enhanced forest structure representation, more precisely aligned edges, and better differentiation between forest patches of varying heights.
Qualitative comparison of canopy height maps for the reference year 2020.
Contribution 2: We obtain significantly better results for tall trees.
Our model predicts the height of large trees more accurately and is also able to detect single large trees close to larger areas of small trees, which has not been possible before. Further, our approach more closely matches the distribution of the labels and reduces the width of the scatterplot. This improves carbon stock estimates and helps spot old-growth forests.
Boxplots for each model showing the 2020 mean error in every 5m bin between 10m and 40m. Although Liu et al. (2023), Pauls et al. (2024) and Lang et al. (2023) perform well on smaller trees, our model performs especially well for taller trees.
Left: Scatterplots between 2020 GEDI labels and prediction for different models, including $R^2$ for all labels and $R^2_7$ for labels exceeding 7m. Right: Histograms of GEDI labels and all maps. Turubanova et al. and Tolan et al. saturate at 28 m, our model is the only one matching above 40 m.
Contribution 3: We can track changes over time.
By applying our model across multiple years (2019-2022), we can observe how forests evolve over time. Our approach successfully identifies disturbances and regrowth. However, a four-year span is insufficient to capture very slow growth due to high uncertainty levels.
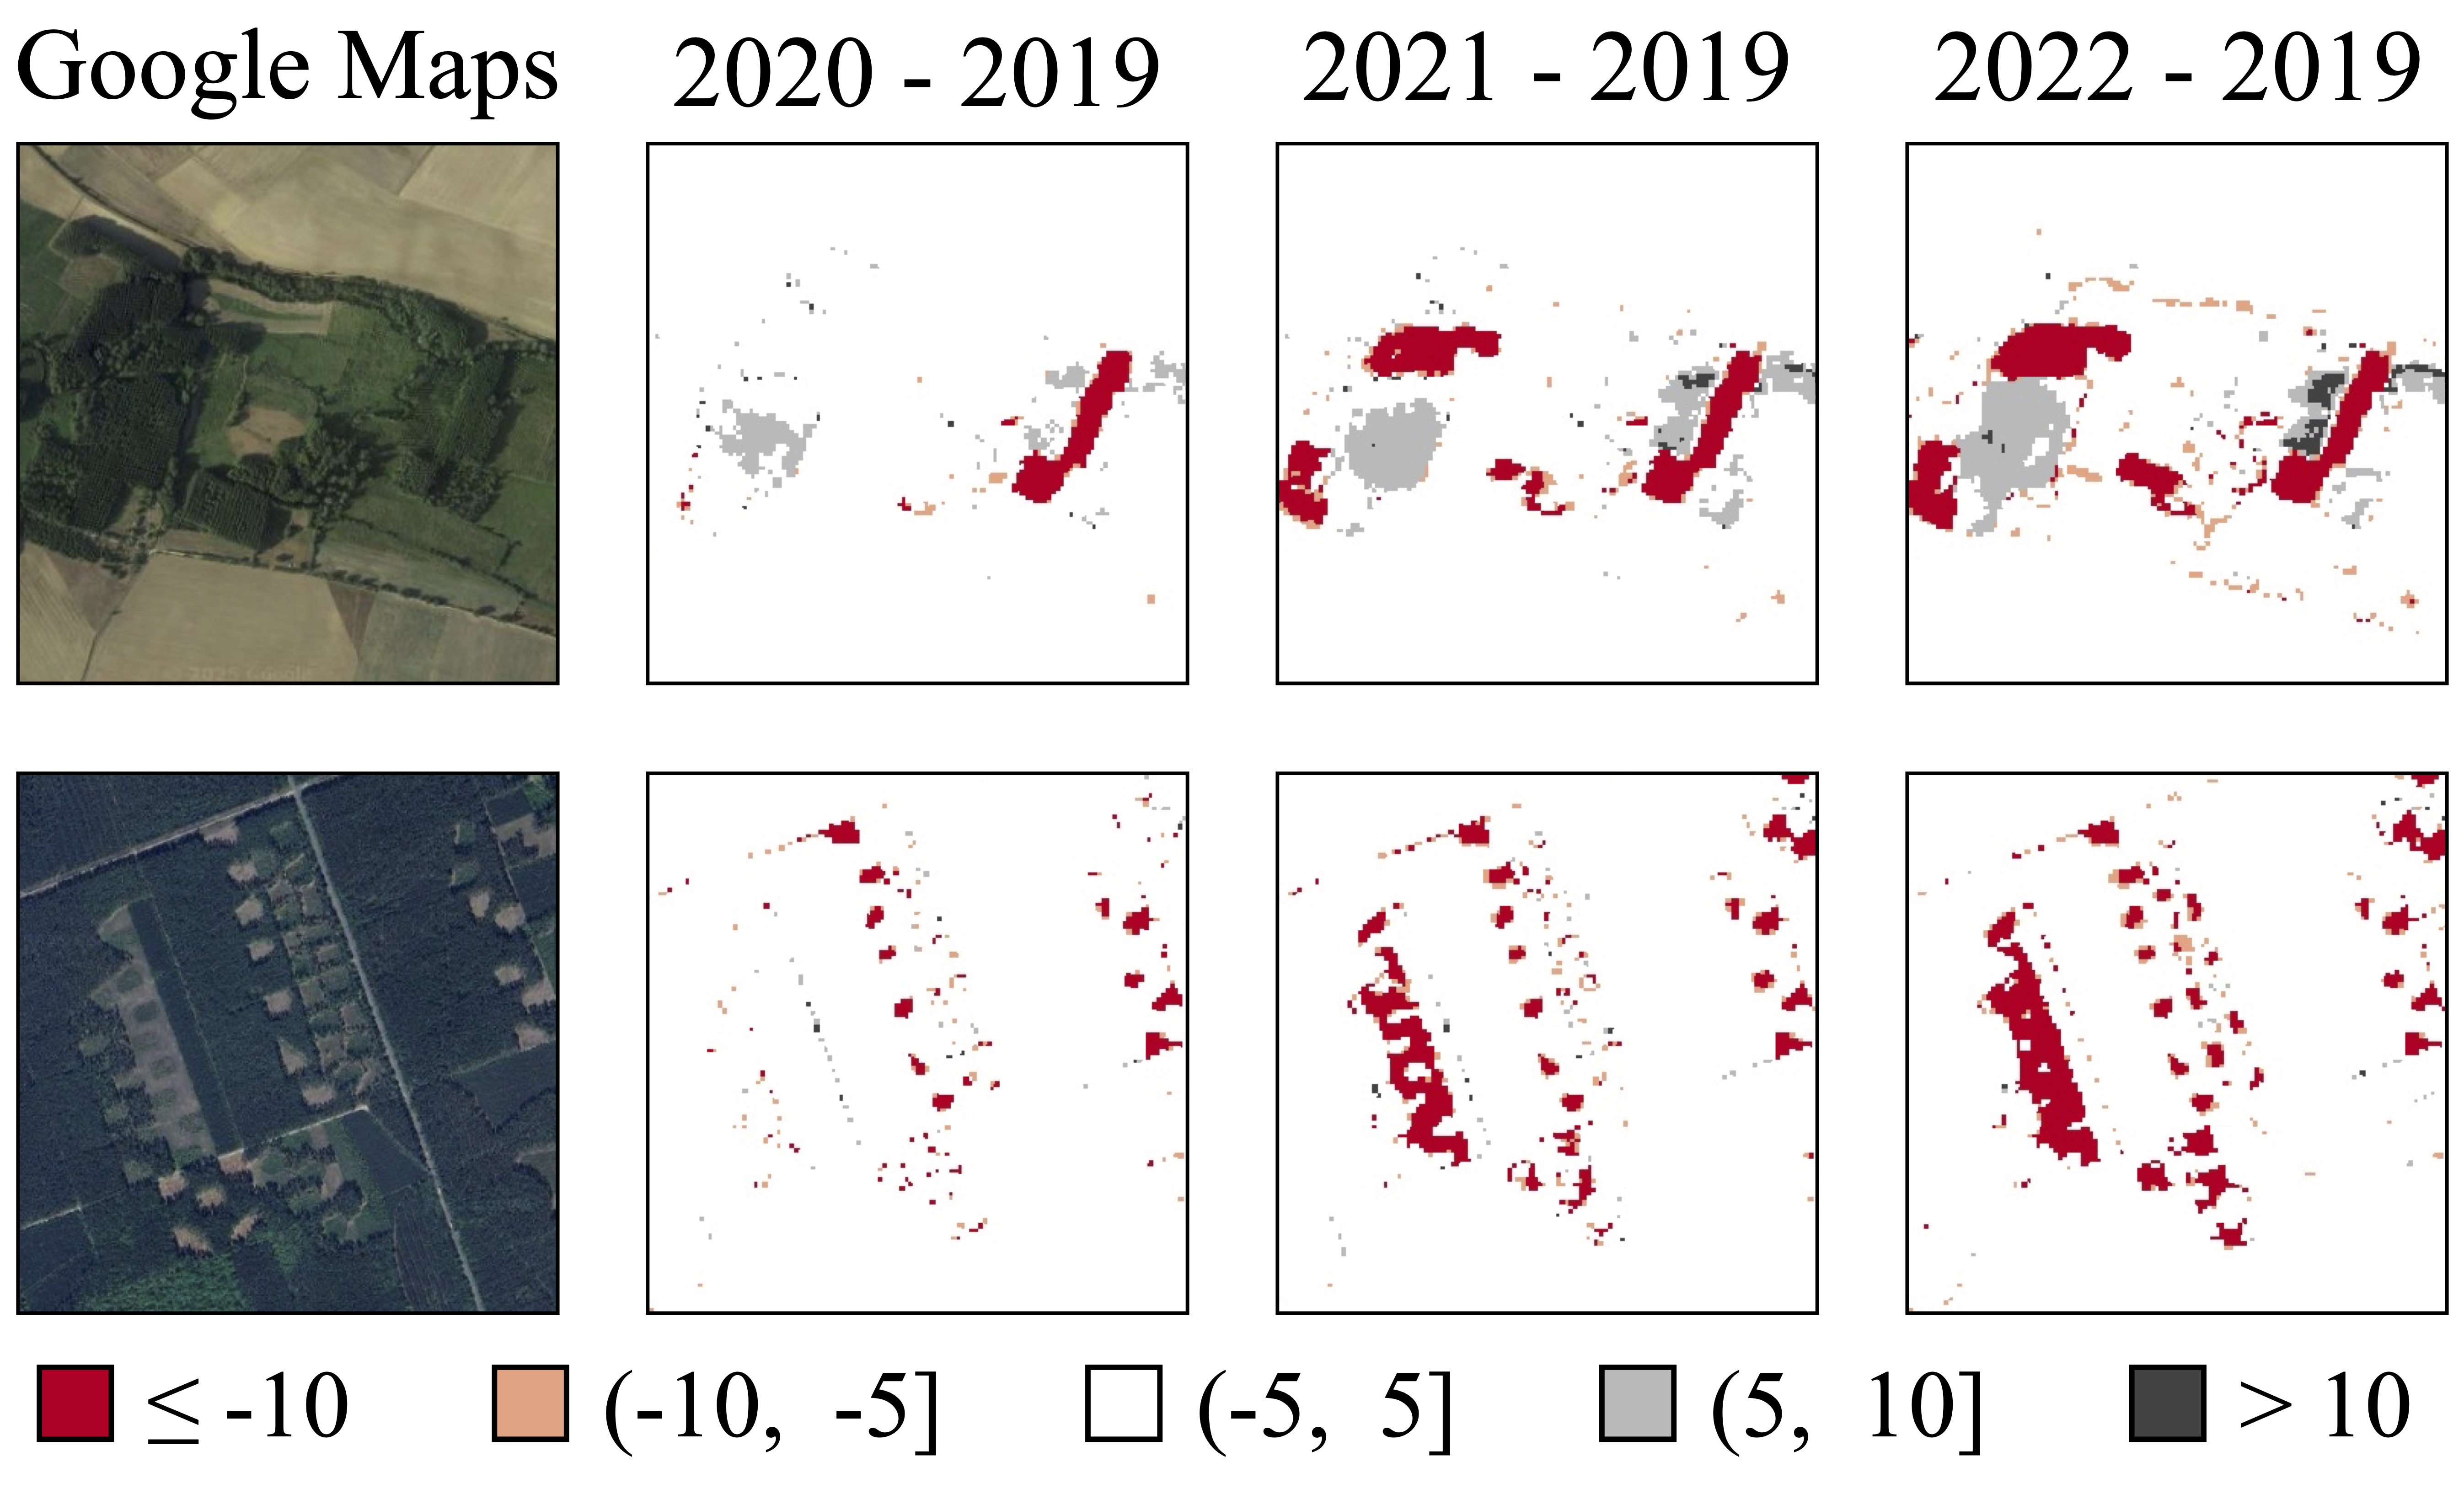
Temporal maps illustrate the expansion of deforestation from 2019 to 2022. This is observed by comparing differences between each year, visible in both solitary forest patches surrounded by open land and within densely forested areas.
Conclusion
Our approach to large-scale temporal forest height estimation surpasses all previous methods in accuracy, particularly for tall trees. Additionally, by applying our model across multiple years, we have developed a temporal change map capable of tracking disturbances and regrowth.
A central limitation of our work is that, due to the huge dataset size, we only applied our model to the European continent. We plan to extend our work to the entire world in the future.
If you find this work useful, please consider citing our paper:
BibTeX
@inproceedings{pauls2025capturing,
  title={Capturing Temporal Dynamics in Large-Scale Canopy Tree Height Estimation},
  author={Pauls, Jan and Zimmer, Max and Turan, Berkant and Saatchi, Sassan and Ciais, Philippe and Pokutta, Sebastian and Gieseke, Fabian},
  booktitle={Forty-second International Conference on Machine Learning},
  year={2025},
  url={https://openreview.net/forum?id=ri1cs3vtXX}
}